
Graphing Transit Systems
I’ve been away from the blogging world for a while! The last few months included a fantastic and inspiring trip to Transportation Camp NYC and loads of (mostly) fun weekend work on transit graphs.
In a hodgepodge effort to improve on Javascript, learn React, create a generic graph representation of a GTFS feed, and implement a few graph algorithms, I finally have a working TRANSIT GRAPH DEMO.
Why transit graphs?
While reviewing algorithms on Jason Park’s algorithm visualizer, I thought, “WE CAN APPLY THESE TO TRANSIT.” It was a moment of pure destiny. To call it multidisciplinary intrigue would be underselling my excitement. Of course, I was not the first person to connect transit and graphs; Google Maps, Open Trip Planner, and Mapzen’s Valhalla are all built on graph representations.
My original goal was to display an animated graph traversal of the New York City subway system. I’ve ended up with a platform to study graph algorithms on transit maps. (I learned that if I’m unsure what I’m building, just call it a platform. The solutions will follow.)
As is the norm in 2016 JavaScript, I used almost as many tools and libraries as there are NYC subway stations. My goal in all projects is to use as little custom data as possible, so I stuck with my Boston model and loaded the MTA GTFS feed into an Amazon RDS Postgres instance. The backend is a Node.js server which boots up after constructing a graph. I used the new ES6 ‘class’ keyword to create a TransitGraph in the style of the object-oriented languages I was raised on. The original frontend was written using JQuery, but when I reached the point of implementing an autocomplete search box, I knew I needed to up my tool game. Enter: React. Facebook’s documentation on the library is quite comprehensive and I latched on to the object-oriented feel and state-based programming model. All the data (stops and routes/edges) is communicated via WebSocket that persists through an entire client connection.
As you can see when using the graph demo, there are three modes. A bit on each…
Shortest Path
Dijkstra’s is the classic gateway algorithm to finding shortest paths in graphs. Wikipedia’s explanation is as clear-worded as I’ve read, so I’ll defer to them:
It picks the unvisited vertex with the lowest distance, calculates the distance through it to each unvisited neighbor, and updates the neighbor’s distance if smaller.
Fire up the algorithm visualizer for to help picture this. In my graph, the edge weights are the time between stations. After running Dijkstra’s, we have an ordered sequence of nodes which represent the shortest path between the origin and destination and the time it would take to do so.
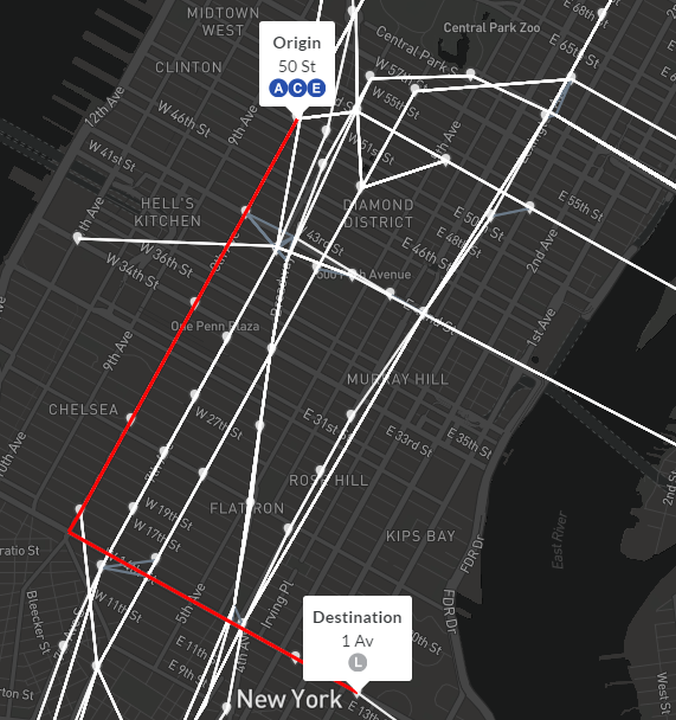
A sample shortest path from 50th St to 1 Av. The routes which serve each station are derived from the GTFS feed based on the trips that pass through that stop. This can periodically result in slightly different route listings than the official MTA map.
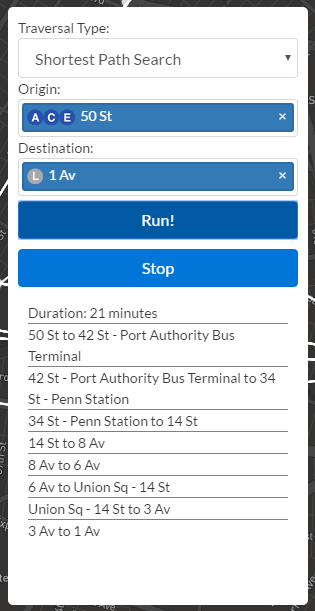
The user interface to pick the origin and destination nodes. I studied Pinterest's CSS to help build the stop tokens that populate the input fields when selected. The route details at the bottom uses "display: flex", a tip I picked up from the Google Maps CSS.
Sound familiar? Google Maps transit directions do the exact same time. And much better! Knowing when to switch trains becomes a luxury after using my tool.
Depth-First Search
A depth-first search, or DFS as the real algorithm geeks call it, is a classic traversal method for both graphs and trees. The idea of a traversal is to visit all the nodes in the graph which can be reached given a starting node. The depth-first variety is contrasted with the breadth-first procedure (up next!) in that, given a starting node, one of its neighbors is visited, then one of it’s neighbors is visited, then one of it’s neighbors is visited, then one of it’s neighbors is visited, then one of it’s neighbors is visited, then one of it’s neighbors is visited, then one of it’s neighbors is visited, then one of it’s neighbors is visited, then one of it’s neighbors is visited, and so on. Was there anything weird about that last sentence? This is a recursive algorithm! When a visited node has no unvisited neighbors, the algorithm pops back up the call stack, testing for unvisited neighbors at each level.
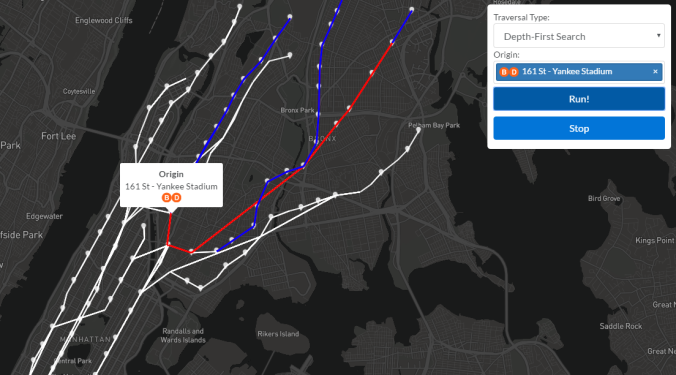
A snapshot of visited nodes early in a depth-first search from 161 St – Yankee Stadium. A red line segment is an edge that has been visited, but not unvisited, while a blue line segment has already been unvisited. As the recursive function pops higher up the call stack, more edges turn blue.
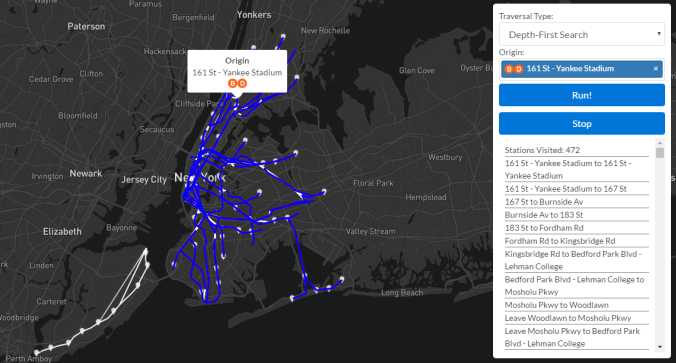
We can see that at the completion of a DFS from 161 St – Yankee Stadium, the entire MTA subway system has been visited. The nodes that have not been visited are the Staten Island railway, which has no rail connections to the subway system and therefore no edges in my graph.
Breadth-First Search
A breadth-first search is another traversal variant whose lofty goal is to identify connected components of a graph while providing zero valuable info to passengers riding transit. (Now would be a good time to say that identifying connected components will play a key role in merging nodes during a later step in this project. Traversals are a necessary part of any graph analyzer’s toolkit!) As you may have guessed, a BFS goes wide before it goes deep. From a given node, all of its neighboring nodes are visited before any of their neighbors are visited. This produces a different exploration pattern, which is illustrated in the following three images.
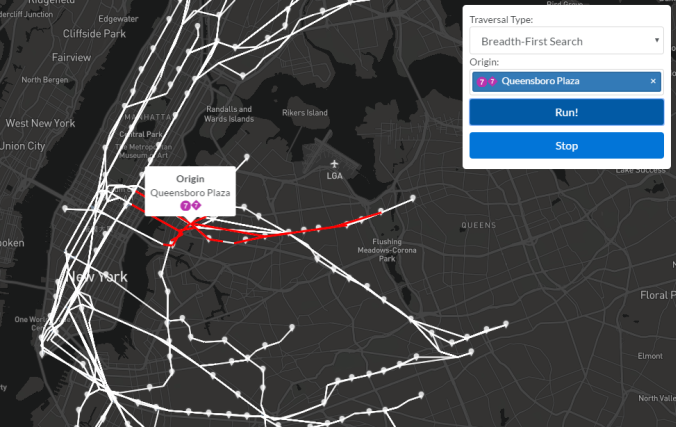
A snapshot early in a breadth-first search from Queensboro Plaza. We see that the visited nodes are spreading outward from the source. Think: diseases. Depth-first search is how you solve a maze and breadth-first search is how you get sick.
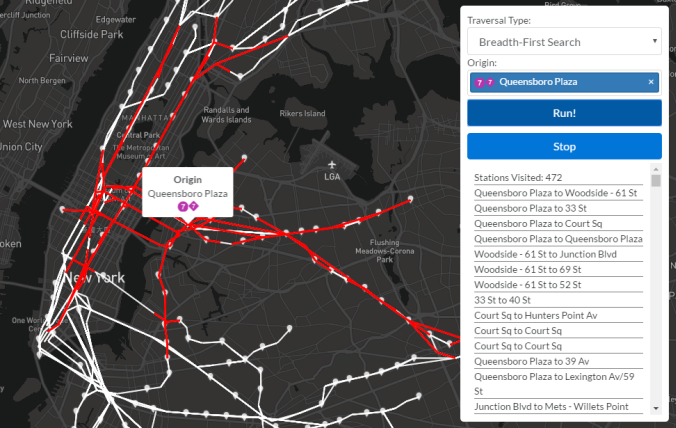
A bit farther in the breadth-first search, we can see the disease…err…graph traversal has continued to spread outward.
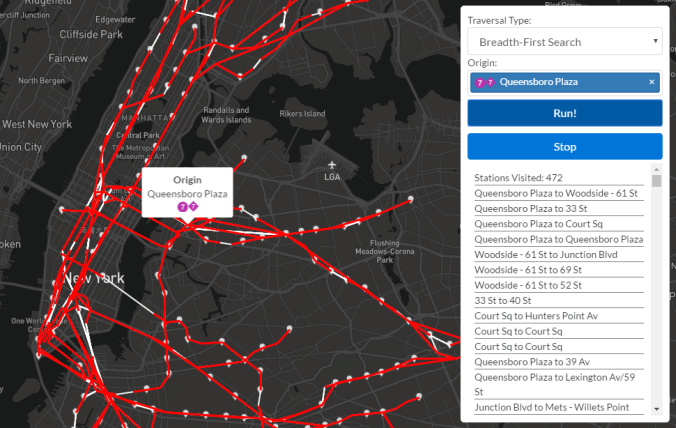
The visited edges at the completion of the breadth-first search. There are no blue edges because this is not a recursive algorithm.
What’s next?
gtfs-graph (the GitHub project name for now – please help me come up with a better one!) is built to be system-agnostic. I have graph representations for Boston and Paris in addition to New York City. While the GTFS standard allowed me to construct all three graphs in similar ways, there were still a few quirks, resulting mainly from how the different systems represent sub-stops (parent/child or northbound/southbound).
Recently, I have been implementing centrality algorithms to see how the results varied from system to system. Paris’ RATP heavy rail lines certainly look to have higher connectivity than Boston’s hub-centric design, and I’m working to find the numbers to prove this. If I can indeed prove this, I’d like to use a genetic algorithm to efficiently enhance (add lines and stops) a system to match the connected-ness/centrality distribution/equity/whatever-metric-I-end-up-with of a higher quality system.
After implementing Google’s PageRank algorithm, I decided it is a poor model for transit. The rankings currently displayed are a modified version of closeness centrality. I really enjoyed this white paper on a node importance algorithm and plan to implement this soon. It uses random walks to calculate the entropy of a given node after a given number of steps.
I hope to have a much more detailed most on these metrics in the coming weeks! I would love to hear any thoughts or ideas you might have about any or all of this!
Let’s build awesome things to help transit, cities, and, most of all, people.