
Updated: New York City Transit Frequency Visualization
Since I detailed my New York City transit frequency visualization project last month, there have been a few updates. Check out the web tool to view the changes!
What’s new?
- The frequency buckets have been realigned to better parallel the psychology of how we use transit. The bins now group trips of less than 4 trips per hour, 4 to 8 trips per hour, and more than 8 trips per hour. Less than 4 trips per hour is generally the threshold where riders should consult a schedule before waiting on a curb, so it was important to separate these visually. The thickness of each edge now also increases with frequency.
- There is now much more coverage in Queens bus data. No, MTA did not see my first update and decide to expand Queens service, though that would be awesome! I communicated with the Transitland team and my tool helped them discover they were previously missing the feed for the MTA Bus Company. It was historically a separate company and still has its own GTFS feed. I came up with some wild conclusions in my previous post on this project, several of which were rendered invalid by the completion of the data set.
What’s up next?
I’d still like to filter the express bus routes, provide finer-grained sorting by mode, and increase the dynamic nature of the tool in general. I’ve been working on an updated Ruby client to pair with the Transitland datastore, and have already updated my project source with the new interface. I’ve also begun dabbling with GTFS-realtime and plan to build a project with this specification soon.
We’re all #InTransit everyday and I hope to have many more updates soon!
What kind of things are you working on? Let me know in the comments below!
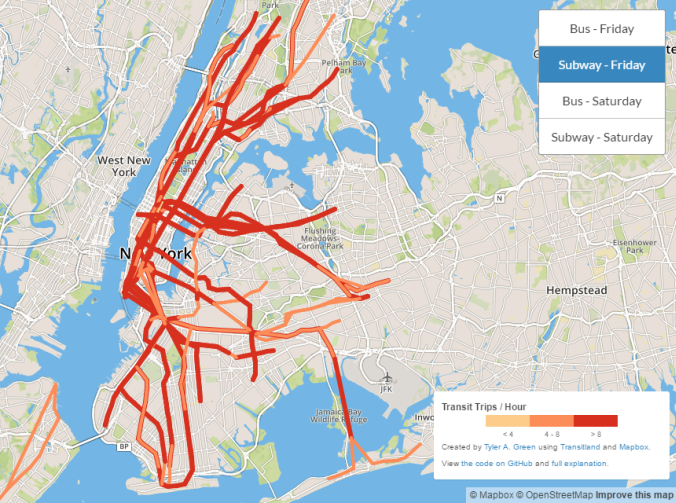
The frequency data for subway routes on a Friday morning in New York City. The darker the color, the higher the frequency!