
Transfort Bus Stops Through the Lens of GIS
To better understand the Fort Collins population and what percentage of it is adequately served by Transfort bus stops, I decided to jump on board the GIS-hype train. I downloaded QGIS, read a bit at qgistutorials.com, and felt ready to dive in.
You’re talkin’ about Transfort bus stops?
You bet I am! To begin (and prove to myself this wouldn’t be the most manual project I’d ever taken on), I collected data from several sources. I have included a Links section with paths to download the data yourself. You can also jump straight to the data, though you’ll miss some sweet graphics along the way.
- Transfort – I could not find shapefiles for either the Transfort stops or routes, so I began with the GTFS feed. Data in this transit agency standard format is in a series of comma-separated text files. The three of interest to me were the stops.txt, shapes.txt, and routes.txt.
- City of Fort Collins – I used two shapefiles provided by the city, ones of city limits and street centerlines.
- Colorado Information Marketplace – Fortuitously, Colorado publishes population data on the census block level. These correspond to city blocks, which were necessary for analyzing the population within Fort Collins.
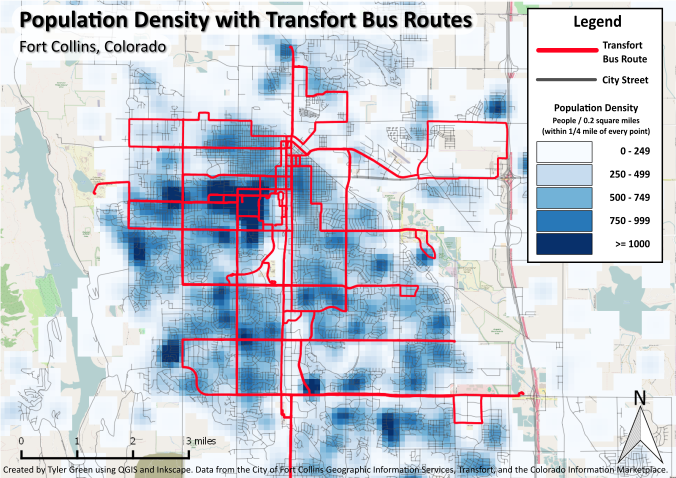
To visualize the population density, I began with a heatmap. The census blocks shapefile is essentially a table of polygons, each with an attribute containing the population of that block in 2010. I filtered the layer to only include blocks within Larimer County and then created a layer of the census block centroids, which turned each polygon into a point. At this point, the default layer unit was degrees. To analyze this layer in meters, I reprojected the layer to SIRGAS 2000 / UTM Zone 13N. I then created a raster heatmap with a radius of 402 meters, which corresponds to a quarter-mile radius. This is an area of approximately 0.2 square miles, which is also listed in the map legend.
Before analyzing bus stops, I wanted to visually present each Transfort route. This required converting the shapes.txt file into a routes shapefile. QGIS can do this with the “Points to path” tool under Vector Creation algorithms. I have uploaded the resulting shapefile, along with PDFs of the following maps, in the Downloads section.
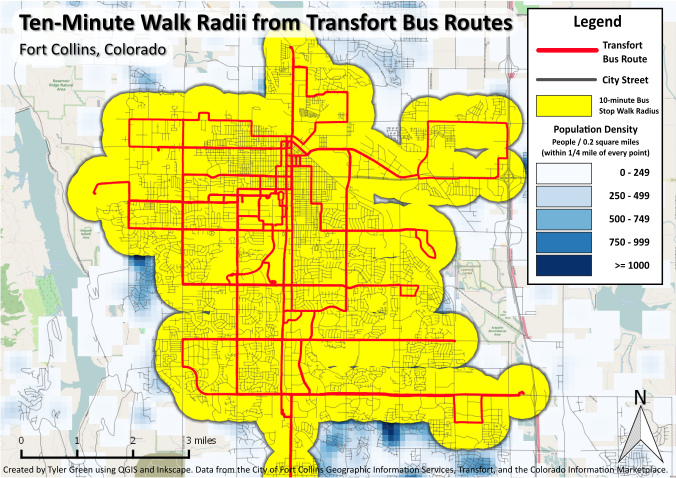
In addition to population density, I wanted to study walking distance from Transfort bus stops. Latitude and longitude information for each stop is contained within the stops.txt file. The QGIS plugin MMQGIS allows imports of these using “Geometry Import from CSV File.” I again needed to reproject the resulting layer to SIRGAS 2000 / UTM Zone 13N to ensure the layer units were meters. I wanted see the results of a 10-minute walk radii, so I created 804 meter (half-mile) buffers around each bus stop.
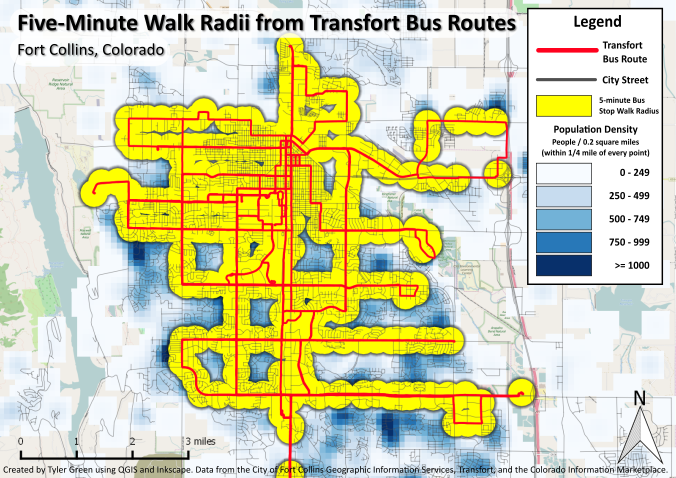
Since the half-mile coverage seemed surprisingly complete, I created a layer of 402 meter (quarter-mile) buffers around each bus stop to show the area within a 5-minute walk.
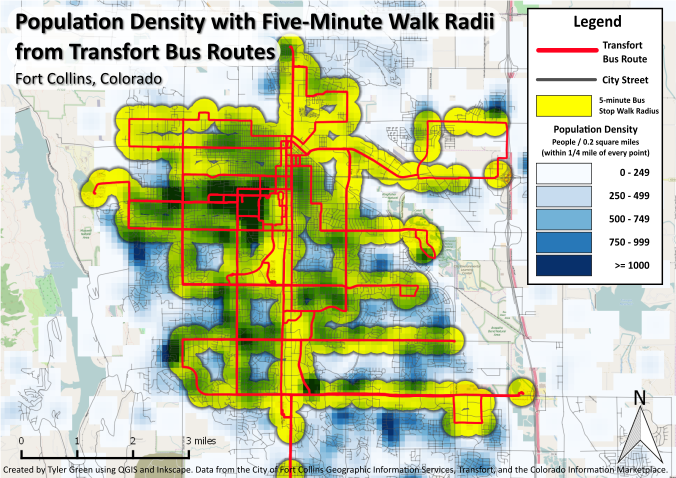
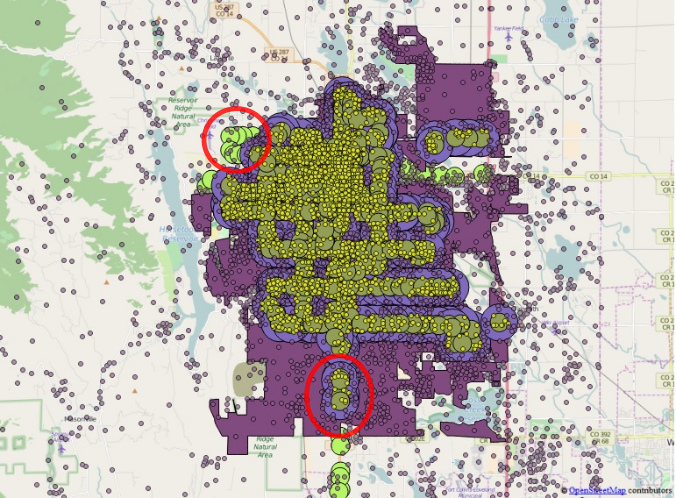
To allow the population density layer to blend with the walk distance buffers, I changed the layer blending mode to Darken. The shades of green in the image below show dense areas overlapping with a 5-minute walk radius from a bus stop.
Do you have any numbers I can ‘wow’ my friends with?
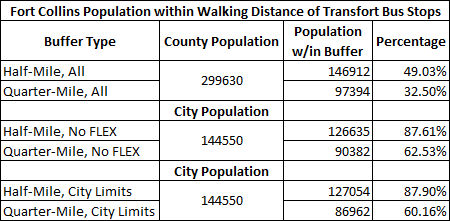
I’m glad you asked! Another powerful feature of GIS is quantitative analysis. I used “Basic statistics” on the 2010 population field of the census block centroids layer to calculate the population of Larimer county. For the population of Fort Collins, I selected the census blocks that lie within the city limits polygon using a Spatial Query. Running statistics on these selected census block centroids produced the city population number in the table above.
You can see that the first half-mile buffer population is larger than the city population. I calculated the population within the walking distance buffers using two methods to adjust for this:
- No Flex Route – The FLEX is a commuter route operated by Transfort whose northern terminus is the South Transit Center. Several of its northern-most stops are inside Fort Collins city limits. I made the decision to remove the population near FLEX stops as commuter bus service has lower frequencies, and therefore different usage patterns, than a typical city bus. This was accomplished by joining the stops shapefile with stop_times.txt and trips.txt to give each route a column with its route name. I then used the Query Builder to select all stops whose route name was not “FLEX”.
- City Limits – The northwest corner of the Transfort routes actually runs outside of Fort Collins city limits, meaning the people living close to these stops were not included in my calculated city population. I performed a Spatial Query to select the bus stops within the city limits polygon boundary. These are the only stops I calculated buffers around when selecting census blocks for this method.
In the figure below, the bottom center red circle shows the location of the first adjustment and top left red circle the second.
What does this mean?
You can see that the east side of Fort Collins contains both fewer dense areas and fewer routes, especially north-south routes. I have seen a pre-MAX Transfort map (pre-May 2014) that contained a north-south route on Timberline Road, the easternmost arterial in Fort Collins. While it is disappointing that ridership supposedly did not justify keeping this route, the density numbers back up this service change.
The half-mile buffers confirm that the city is broken into a square mile grid. The two east-west routes (Horsetooth and Harmony) in the southeast corner of the map show the half-mile circles bumping against each other, creating a distance of a mile between the two roads.
Depending on the metric, between 60% and 63% of Fort Collins residents are within a five-minute walk of a Transfort bus stop. This is significantly higher than I would have guessed. However, being near a bus stop is only part of the story; frequency of service and driving disincentives also play a major role in whether a resident will ride the bus or not. Parking is quite easy in most of Fort Collins and the areas where it is harder, mainly Old Town, provide markedly sub-market value parking. The headway on the routes, excluding the MAX, is either 30 or 60 minutes. And there is no Sunday service. All this goes to say living within 5 minutes of a bus stop does not necessarily make for a transit heaven. It should also be noted that the block-level populations may have significantly changed since the 2010 census.
Regardless, having 87% of your population live within a 10-minute walk of a bus stop indicates an overall lack of transit deserts and a fairly comprehensive bus system. I think Fort Collins is very close to a big shift in transit culture!
For better or worse, I will now scrutinize the density surrounding my Transfort bus stops and routes even more. Here’s what I can tell you from my observations thus far: it’s not great. Here’s what the data says: it’s not great. And here’s to using data to continue to improve our city and its bus service!
Let me know if there is more I can do with this data! I’d also enjoy seeing analysis of this type in your own city.
Until next time, ride on!
Downloads
Population Density with Transfort Bus Routes PDF
Ten-Minute Walk Radii from Tranfort Bus Routes PDF
Five-Minute Walk Radii from Transfort Bus Routes PDF
Population Density with Five-Minute Walk Radii from Transfort Bus Routes PDF
Links
Transfort GTFS Feed
http://www.ridetransfort.com/developers OR
https://code.google.com/p/googletransitdatafeed/wiki/PublicFeeds OR
City of Fort Collins
http://www.fcgov.com/gis/downloadable-data.php
Colorado Information Marketplace
https://data.colorado.gov/Demographics/Census-Blocks-2010/xipb-k5bu